
Monitoring The Greenhouse Environment
 June 14, 2011
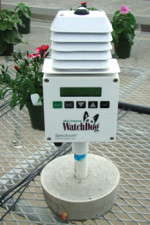
How do you make decisions related to crop production in your greenhouse? The most common decision-making aids are notes made during previous production seasons and reacting to problems that arise. While using notes and reacting to situations as they arise are commonplace, each season and year is going to be different than the previous one. The first step toward making educated decisions and avoiding problems is to monitor factors that affect your crop production.
Constant monitoring can help growers make decisions and help manage the causes of problems as opposed to treating symptoms.
This is the first article in a series focused on monitoring the greenhouse environment, plant growth and development, substrate pH and EC and water quality, and greenhouse pests and diseases. These articles will provide concepts and ideas to help you develop a comprehensive greenhouse monitoring program.
This particular article will focus on monitoring the greenhouse environment. Because temperature and light are the primary environmental factors affecting greenhouse crop production, we will focus on these areas in this article.

Temperature
Temperature is one of the driving factors in crop development. However, there are different types of temperatures that affect plant development in which growers can monitor. These include plant, air and substrate temperatures.
Plant temperature controls the rate of plant development. For instance, the temperature of plant tissue affects the rate of leaf unfolding, flower bud development and stem elongation. However, plant temperature can be difficult to measure without sensors such as infrared (IR) thermometers. By measuring air temperature, we can get a rough estimate of plant temperature and, as a result, air temperature is the most common temperature measured in the greenhouse. Monitoring different air temperatures, including minimum, maximum, average daily temperature (ADT) and the difference between the day and night temperature (DIF = day temperature–night temperature) are all useful in crop production.
Additionally, substrate temperature is important for propagators of cuttings and seeds because there are specific substrate temperature requirements for seed germination and callus and root development.
Light
In addition to temperature, light impacts crop growth and quality. While photoperiod can affect plant processes such as flowering and dormancy, changes in photoperiod are consistent year-to-year. Therefore, the most important aspect of light to monitor is quantity because this varies greatly throughout the days, months and years.
Light quantity can be measured both instantaneously and cumulatively. Instantaneous light levels directly impact current photosynthesis rates which, in turn, impact crop growth and quality. Instantaneous light is important to measure when making decisions such as whether to pull shade cloth or when to turn on supplemental lamps.
However, one limitation with measuring instantaneous light levels is that they vary widely throughout the day. As a result, research shows that the light accumulated over the course of a day is just as important as instantaneous light for describing and controlling plant growth. Daily light integral (DLI) is the term we use for describing the daily accumulation of light. For many crops, flower size and number, overall mass and branch number increase with DLI.
With the knowledge of which environmental conditions we should be measuring, how do we approach measuring them? Fortunately there are several options available to growers, ranging in precision, accuracy and cost.
Temperature
The simplest way to measure air and substrate temperatures is using thermometers. For instance, thermometers may be placed in the substrate of plug or liner trays to measure substrate temperature. Similarly, thermometers may be suspended above crops to measure current air temperature or minimum and maximum air temperatures. Growers can also measure plant temperature using handheld IR thermometers.
While thermometers are useful in measuring temperature, they do not have the capacity to collect and log data. Therefore, growers must continuously check and record the values of thermometers. Alternatives to thermometers are sensors connected to data loggers or data loggers with internal sensors, such as the WatchDog weather station manufactured by Spectrum Technologies (Figure 1, see below). Additionally, some of these units will calculate and report the minimum, maximum, day and night temperatures, as well as the DIF.
An alternative option is to purchase a temperature sensor or thermocouples to place in the air the substrate and connect it to a data logger. If your greenhouse facility has an environmental computer such as a PRIVA or Argus, you may also be able to connect external temperature and light sensors to them.
The most important step to take to ensure you are getting accurate temperature readings is sensor placement. We frequently see temperature sensors suspended from the ceiling in the middle of a walkway and several feet above the canopy of the crop. This type of placement can lead to temperature readings several degrees different than the temperature around the plants. Instead, sensors should be placed just above the plant canopy in the middle of a bench and protected from direct sunlight (Figure 2, see below), which will provide temperature readings more relevant to what the plant is experiencing. Substrate temperature sensors should be covered in substrate, not exposed to air. Similarly, position IR sensors so they are aimed at plants and not at the bench or floor to ensure you are indeed measuring plant temperatures.
Light
As mentioned already, we are interested in instantaneous irradiance and DLI when measuring light. Growers have used footcandle meters to check current light levels in the greenhouse for years. Although these instruments are handy, they are not the most accurate instruments to use. Footcandle meters measure “photometric” light (the light that is visible to the human eye) which includes light not used by plants for photosynthesis. An alternative and more accurate way to measure light is using a sensor that measures “quantum” light. A quantum light meter will measure the light that is used for photosynthesis, or photosynthetically active radiation (PAR). Quantum sensors measure instantaneous light, reported in micromoles (µmol) per square meter (m¯²) per second (s¯¹), or µmol∙m¯²âˆ™s¯¹. The cumulative measure of light, DLI, is reported in moles (mol) per square meter (m¯²) per day (d¯¹), or mol∙m¯²âˆ™d¯¹.
The tool you select to measure light will depend on what you are interested in measuring. If you are interested in measuring instantaneous light, you have two options: a footcandle meter or a quantum sensor. As mentioned earlier, a footcandle meter will give you a rough idea of the light available for plant growth. However, for a better indication of the instantaneous light available for plant growth, select a handheld quantum meter.
When selecting a handheld quantum meter, you’ll need to select a meter with a single-diode or a multiple-diode sensor (Figure 3, see below). Each type of sensor has advantages and disadvantages. A single-diode sensor is smaller and less cumbersome to keep handy throughout the day. However, a multiple-diode sensor takes a reading from each diode and reports the average light level, giving a more “representative” description. As with thermometers, one limitation with quantum meters is that instantaneous light values are reported without logging data over time. Quantum meters may also have the ability to switch between measuring electric and sunlight.
There are a few options for measuring DLI. First, you can calculate a rough DLI by making instantaneous readings every hour and calculating the DLI based off these readings.
A less labor-intensive and more accurate way to measure DLI is using a quantum sensor connected to a data logger that will automatically calculate DLI based on frequent instantaneous light measurements. Similar to measuring air temperatures, some data loggers may have a quantum sensor built into the unit, or external quantum sensors may be connected to a data logger (Figure 4, see below). When selecting an external sensor, the same concerns about selecting a single- or multiple-diode sensor for a handheld unit mentioned earlier apply.
To maintain accurate light readings, wash off the surface of the diodes with de-ionized or reverse osmosis water and a soft cloth weekly to keep the surface clear of dust, water spots or debris. Also, use a hand level to ensure the sensor is level to get the most accurate readings.
Conclusions
So what do you do once you’ve started to monitor, measure and collect data? The most beneficial way to use environmental data is to enter the data into a computer spreadsheet to store for reference and create graphs (visit GreenhouseGrower.com for a sample graph). By creating and sharing graphed environmental data with your production team, you will be able to make informed decisions about how to manage the greenhouse environment to produce the highest-quality crop every season.
Subscribe to eNewsletter