


Selecting Fertilizer Rates For Several Spring Bedding Plants
Fertilizing bedding plants can be difficult due to the differing needs of the large variety of plants that we grow. Many operations do not grow enough of any one crop to cater the fertilizer specifically for each crop. Therefore, grouping crops with similar fertilizer requirements and having two to three fertilizer strengths available is a practical way to ensure plants are getting the fertilizer they need. With many new plant varieties on the market, we wanted to conduct a trial at Cornell University to determine best fertilizer rates for several common bedding plant crops.

View all


22 Bedding Plants Studied To Establish Fertilizer Rates
Plugs and rooted liners of 22 crops (Table 1) were transplanted into 4-inch (500 mL volume) round pots with a commercial peat/perlite based substrate. The plants were grown in a glass greenhouse at Cornell University during the spring season at a spacing of one plant per square foot. Heating set points were 68°F during the daytime and 61°F during the nighttime.
Plants received overhead watering daily (or as needed) with 21-5-20 water-soluble fertilizer (WSF) supplemented with 30 ppm magnesium from magnesium sulfate. We watered plants to achieve about a 10 percent leaching fraction.
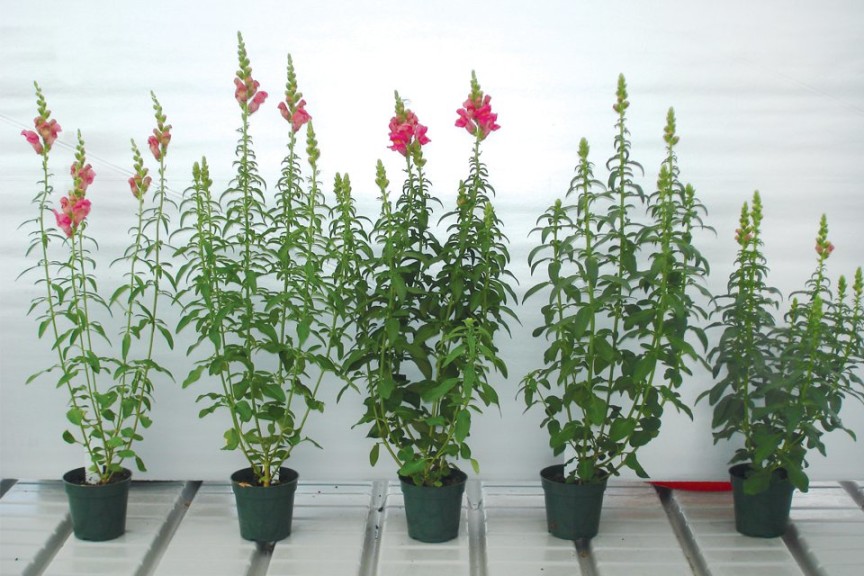
[blackoutgallery id=”75356″]The fertilizer concentration treatments applied were 50, 100, 200, 350 and 500 ppm N from 21-5-20. We selected this range so as to be able to observe symptoms of low and high fertility at the extremes. Weekly PourThru samples were taken from several pots in each treatment to determine substrate pH and electrical conductivity (EC). Plants were grown for five to seven weeks, depending on the crop, until they reached the stage of first open flower. At that time, plant visual health and dry weight were assessed.

pH And EC
In general, the preferred substrate pH for bedding plants is 5.5 to 6.5. This varies by species. Optimal pH for iron inefficient plants (such as Calibrachoa, Petunia and Snapdragon) is 5.5 to 6.0. Optimal pH for iron efficient plants (such as seed and zonal Geraniums and Marigolds) is 6.0 to 6.5.
At transplanting, substrate pH was 6.2 (data not presented). The WSF we used is moderately acidic (40 percent ammoniacal nitrogen) and helps to counter the moderate alkalinity of our tap water (120 ppm CaCO3). At the higher WSF rates, 350 and 500 ppm N, substrate pH declined over time and reached 5.5 and 5.0, respectively, by the end of seven weeks. This occurred because the high amounts of fertilizer provided a lot of ammonium to counteract the water source alkalinity, which served to acidify the rootzone.
The opposite response occurred for the lower WSF rates; pH increased to 6.5 for the 200 ppm N treatment and 6.8 for the 100 and 50 ppm N treatments. This occurred because with lower rates of the fertilizer there was not enough ammonium applied to counter the pH increasing effect of the water source alkalinity.
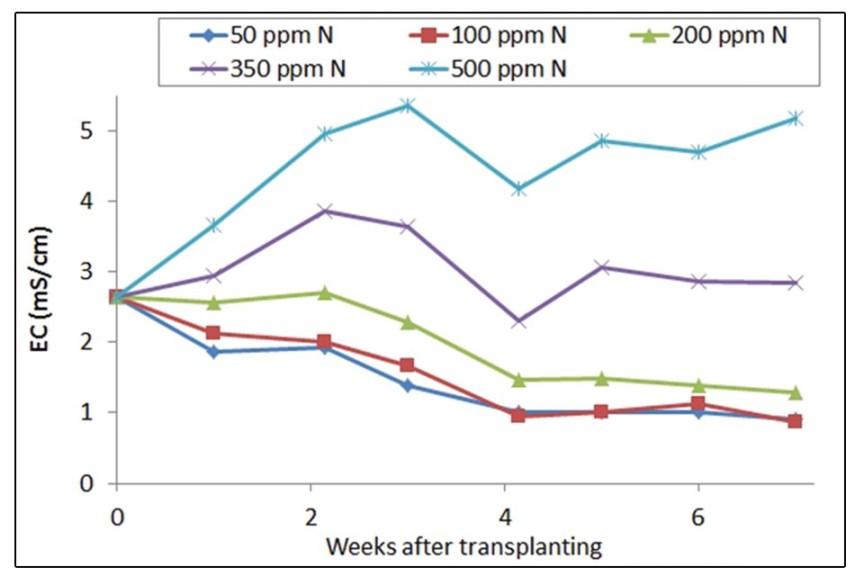
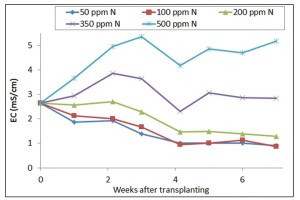
The substrate PourThru EC was initially 2.6 mS/cm (Figure 1). Substrate EC increased to about 4 to 5 mS/cm for the 350 and 500 ppm treatments by three weeks after transplanting. We leached these treatments with clear water to reduce salt accumulation. The EC of the 50 and 100 ppm treatments declined over time to 0.9 mS/cm as the experiment ended. This suggests that much of the delivered fertilizer was being consumed by the plant and not building up in the substrate. In the 200 ppm treatment, EC also declined over time to about 1.3 mS/cm.
Suggested Fertilizer Rates
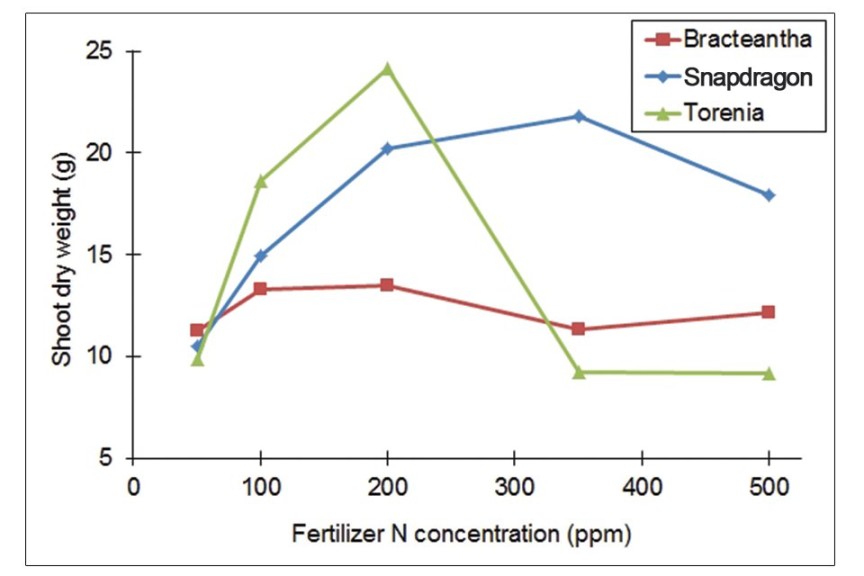
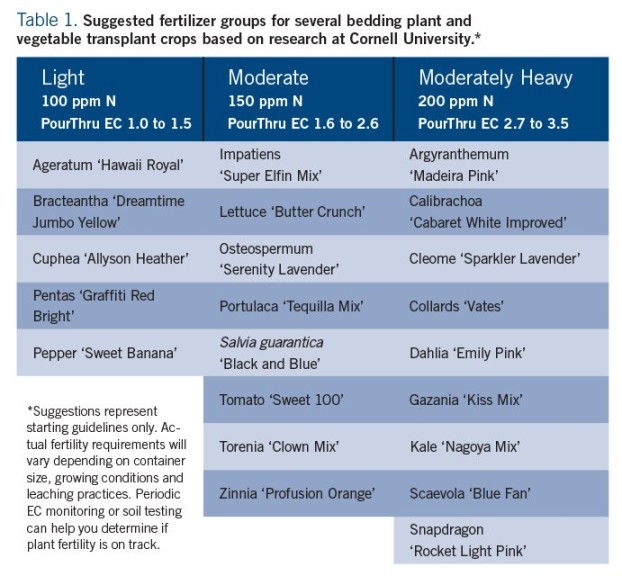
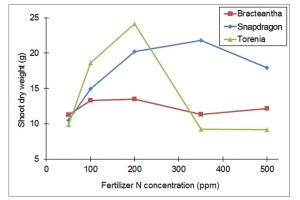
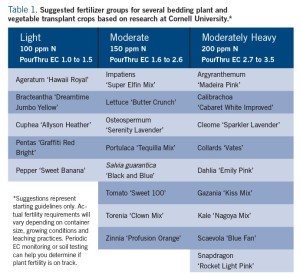
Based on plant growth (dry weight) response to fertilizer, we divided the 22 crops into suggested fertilizer groups: low, moderate and moderately heavy (Table 1). For each crop, the group was selected based on the minimum fertilizer concentration required to reach maximum (or near maximum) growth. For example, Bracteantha ‘Dreamtime Jumbo Yellow’ was representative of plants exhibiting a low fertility requirement. Maximum plant size was reached at 100 ppm N WSF. Increases in fertilizer concentration did not yield further increase in growth (Figures 2 and 3).
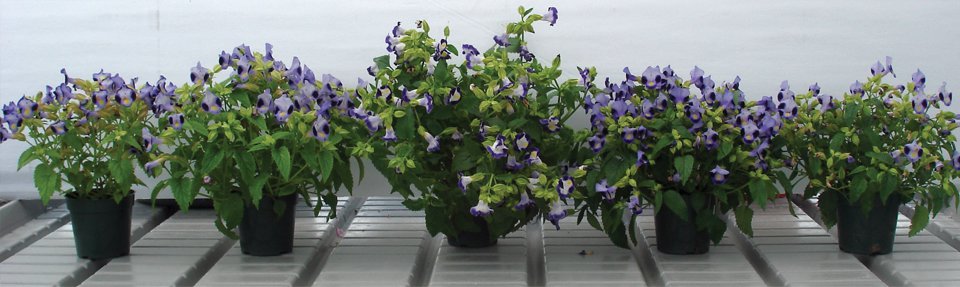
Torenia ‘Clown Mix’ exhibited a moderate fertility response. Near maximum growth was found at about 150 ppm N and growth declined markedly as fertilizer concentration increased above 200 ppm N (Figures 2 and 4).
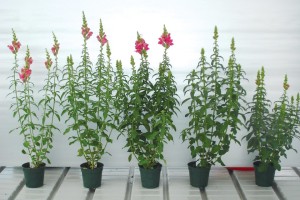
Snapdragon ‘Rocket Light Pink’ is representative of crops with a moderately heavy fertilizer requirement; 200 ppm Nitrogen was required to reach near maximum growth (Figures 2 and 5). Several vegetatively propagated crops also had a moderately heavy fertilizer response including Argyranthemum ‘Madeira Pink,’ Calibrachoa ‘Cabaret White Improved,’ Dahlia ‘Emily Pink’ and Scaevola ‘Blue Fan.’
Symptoms Of Under Fertilizing
General symptoms of underfed plants include sparser growth, less branching and earlier flowering (see 50 and 100 ppm N treatments in Figure 5). In addition, specific nutrient deficiencies may become pronounced. Nitrogen, is the element needed in the largest quantity by plants. Therefore, N deficiency, yellowing of older leaves, is often the first symptom of underfed plants. In our experiment, high substrate pH (>6.5) was found for plants receiving the 50 and 100 ppm N treatments. At high pH, iron and other micronutrients are unavailable to plant roots. We observed symptoms of iron deficiency (yellowing between the veins of upper leaves) for iron inefficient plants grown at low fertilizer treatments.
Symptoms Of Over Fertilizing
When plants are fed more than they require, soluble salts can accumulate in the substrate. With high substrate EC, roots may not be able to extract enough water to meet plant needs. This can lead to shorter plants, as well as leaves that wilt during the middle of sunny days when plants’ water needs are greatest. In addition, plants may accumulate salts at levels that cause damage to leaf tissue.
Grouping Crops To Match Plant Needs With Fertilizer Rate
While a one-size-fits-all fertilizer program may not work for all of your crops, our research demonstrates that grouping crops can be an effective way to match fertilizer rate to plant needs. Our suggested fertilizer groups should be thought of as a starting point for selecting rates in your own operation. Plant fertilizer requirements vary according to environmental factors and how much water is leached at watering.
Periodically monitoring substrate EC is an effective tool to guide fertilizer rates. A pattern of EC increasing over time suggests that plants are being over fertilized; while EC trending down over time suggests plants are being underfed.
It bears noting that in our experiment, each pot was given a square foot of bench space to promote large plant size. When plants are spaced pot to pot, it is often desirable to reduce the fertilizer concentration to promote a more compact plant form and to reduce reliance on plant growth regulators.
Subscribe to eNewsletter