Using Data Loggers in the Greenhouse


 April 6, 2018
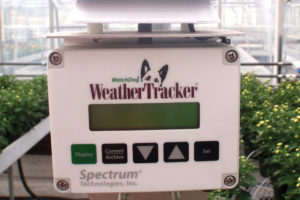
This data logger measures and records light, temperature, and relative humidity. It cannot be connected to a computer so the user must scroll through the LCD screen to view the data.
Editors Note: In this fifth article of this five-part series about the tools you need to measure environmental and cultural parameters in your greenhouse, you will learn why you should be using data loggers and how to best put them to use.
In greenhouse production, we try to control as many inputs to our crops as possible. A wise man once said, “You can’t control what you can’t measure.” Some of the most common parameters we measure in the greenhouse are light, temperature, humidity, etc. Growers have been measuring these parameters for as long as greenhouses have been in use, but what about recording these measurements?
In the past, and maybe in the present, growers have kept crude records of the high and low temperatures of a greenhouse by using a thermometer that marks the points where the mercury reaches its highest and lowest points during a 24-hour period. It was up to the grower to check it, write those values down, and use a magnet to reset those points each day. This is great data, but it really only provides two points during the day. What about the average? When did it get to the low or high points, and for how long? This is where the use of data loggers becomes beneficial.
Types of Data Loggers


Data loggers allow the user to get much more detail about the environment. These instruments can range in complexity and price to match the needs of any grower. To upgrade from the thermometer, a grower can get a sensor that is connected to a small onboard computer that automatically stores the high, low, and average temperatures and keeps them for a couple of months. The grower must go to the data logger and use a small screen to read the values and scroll through the days, as well as record the data for use in the future. Different variations of these same data loggers can also measure relative humidity, light intensity, and the daily light integral (DLI).
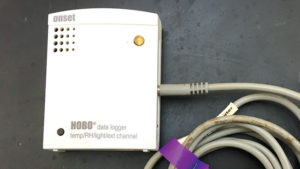
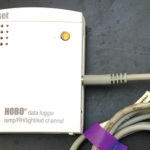
This is a simple data logger that will measure temperature and relative humidity. Data can be loaded by connecting the data logger to a computer and exporting it using the software that comes with the unit. Photos by Brian A. Krug.
To get more detailed information, programmable data loggers are also available. These units can be connected to a personal computer, and with software specific to the particular brand of data logger, the user can program how often the sensor records data. The frequency of data logging can typically range from milliseconds to hours. Data loggers in this category can come in many shapes and configurations. Some will come with only one or two sensors that are factory installed and not interchangeable with others that can be coupled with any number of external sensors. Be aware though, not all sensors are compatible with all data loggers. Be sure to consult the manufacturer to confirm that the data logger you purchase is compatible with the sensors you purchase.
Programmable data loggers are typically some of the most useful ones. Not only can you configure the data logger to record data and different intervals, you can also download the resulting data back to your computer to view and analyze. A programmable data logger with external sensors is often the most flexible unit because you can match the sensor at any given time with your needs in any situation. Today you might be interested in temperature and humidity, and next week you are interested in photosynthetically active radiation. No need to buy a different unit, just have the sensors on hand and swap them out.
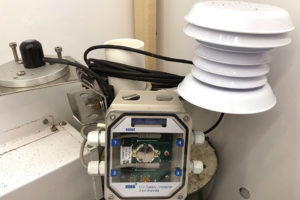
This more sophisticated data logger can be outfitted with up to four sensors. In this example, the data logger is connected to a light sensor and a temperature/relative humidity sensor. These can be replaced with a multitude of different sensors based on need. This data logger can also be connected to a computer for custom programming and viewing data.
When to Use a Data Logger
Most growers do not have extensive environmental control systems that keep historical records of the greenhouse conditions. In these cases, you will find that using a data logger will allow you to see what is happening in the greenhouse when you are not there. This can turn into a valuable diagnostic tool when your plants are not growing the way you expect them to. Looking back a few days or even weeks will give you an insight into the greenhouse environmental conditions (especially during the night).
A good example of this is a grower whose poinsettia crop (short-day plant) was delayed in showing first color. After taking a look back over the last couple of weeks of data, the grower discovered that a bank of working lights was on during the night. He took corrective action, and although some losses were experienced, the crop was partially salvaged. Additionally, he put more safeguards in place to avoid this problem in the future.
If you are a grower that ships plants via truck or parcels, using a simple compact data logger that records temperatures can be a useful tool. Plants in shipping can be sensitive to temperature extremes. Periodically tracking the temperatures in your trucks or shipments can serve as a quality control to ensure that plants are not exposed to such extreme temperatures.
Using data loggers as quality control devices in your greenhouse on a regular basis is always a good idea. We rely on our thermostats and environmental control systems for our livelihood. If they are not working correctly, we risk our bottom line. When was the last time that you checked over a 24-hour period, or longer, that the greenhouse conditions were consistent with your set points? This might sound like overkill, but a Midwest grower was surprised by the discrepancies he found and was able to track down some systemic errors that were negatively affecting crop quality. The grower now has a suite of data loggers and sensors that are deployed on a regular basis that serve as an environmental quality control check.
Another grower has used data loggers to monitor natural light levels to determine when supplemental lighting is needed. Once the natural light levels in the fall dropped below a critical level, the grower began using supplemental lighting. Supplemental light was used until natural light levels rose above the critical threshold in the spring. This practice ensured that the crop received enough photosynthetic light to produce a quality crop and avoided excessive use of lights early in the fall and late into spring.
As mentioned above, there are numerous applications for data loggers and a plethora of data loggers to match your needs and budget. Talk to your growing staff and identify ways to put data loggers to work in your facility to make you a better grower. Once you start using them, you will surely find ways to incorporate them throughout your greenhouse in multiple applications.
Subscribe to eNewsletter