


How to Fine-Tune Fertilizer Use in Containers with AI and RGB Imaging
 August 5, 2025
 Effective nutrient management is essential in container plant production. When fertilizer is applied too late or in insufficient amounts, plants suffer, and so can your reputation as a grower. On the other hand, over-fertilization can lead to salt buildup, which causes leaf burn, distortion, and stunted growth. It also wastes money and contributes to environmental issues like water pollution and eutrophication.
Nutrient management isn’t one-size-fits-all. Different plants have different nutrient needs, and those needs shift as plants grow. To fine-tune your fertilizer program, it helps to monitor changes in plant nutrient status over time. The most common method is to send samples to a lab, which can be expensive, time-consuming, and often involves damaging the plant.
Is there a better way? Absolutely. Because leaf chlorophyll content closely correlates with nitrogen levels, and chlorophyll reflects specific wavelengths of red and blue light, we can now access plant nitrogen status rapidly when using imaging systems, such as optical meters or reflectance sensors, without damaging plants. Of the available options (including fluorescence, multispectral, and hyperspectral imaging), RGB imaging stands out as both easy to use and cost-effective.
How RGB Works for Nutrient Management

Figure 1. RGB table with some basic colors.
The RGB (Red, Green, and Blue) color model uses numerical values between 0 and 255 for each channel, combining to represent more than 16 million color variations (Figure 1).


When a plant is under nutrient stress, its leaves may turn light green, yellow, red, or even brown. By taking a photo of the canopy with an RGB camera, you can capture these color changes and extract RGB values to assess plant health. Because plants under different nutrient conditions display measurable differences in their RGB values, comparing them can help you determine whether a plant needs more, or less, fertilizer.
How to Use RGB Imaging in Production
Snap a photo. Analyze the data. Make informed decisions. It really can be that simple. In a recent study, we tested this method on four container-grown crops — basil, marigold, pepper, and sage — each grown under five different fertilizer rates. Using RGB imaging, we were able to monitor changes in canopy size and leaf color over time and link those differences to plant nutrient status, all without sending samples to a lab.
Capturing and Analyzing RGB Images
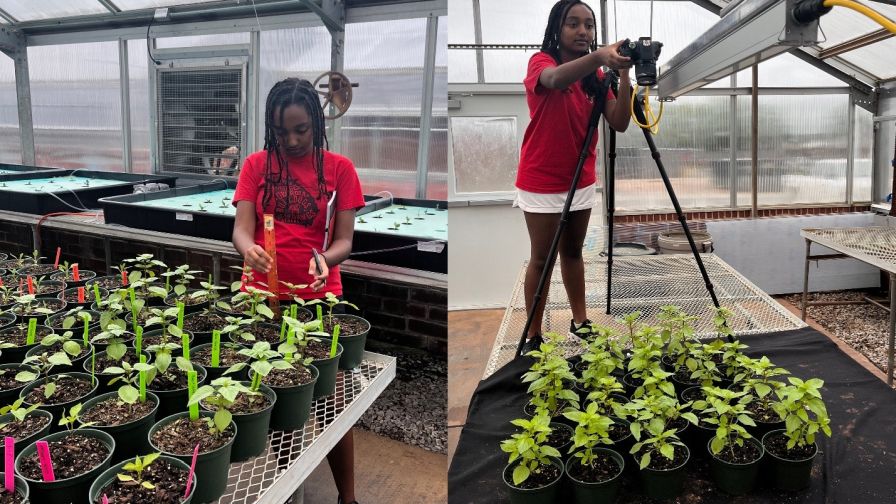
Figure 2. RGB images were taken using a camera and a tripod. Winta Ykeallo, from the University of Georgia Young Scholar Program, is assisting with the experiment.
In our experiment, we took RGB images three times a week using a camera mounted on a tripod, set at a constant height (Figure 2). To help measure plant size, we included a reference square of known area in each shot – something growers can easily create themselves.
Once the images were captured, we imported them into ImageJ, a free image analysis software. Using an automated threshold, the software distinguished the plant canopy from the background and generated a “mask” to calculate canopy area. Next, the images were converted into different color spaces to extract the average red, green, and blue values through an automated color analysis workflow (Figure 3).

Figure 3. RGB imaging analysis.
Turning Data into Decisions
To analyze the data, we used another free tool: R, a statistical computing software. Based on each plant’s performance and the amount of fertilizer it received, we assigned it one of three labels:
- “Needs fertilizer”
- “No need for fertilizer”
- “Needs less fertilizer”
These labels, along with canopy area and RGB values, were then used to train and evaluate five different supervised machine learning models for predicting fertilizer recommendations.
What the Data Showed
As expected, increasing fertilizer rates generally improved plant performance across all crops. Plants that received the lowest fertilizer rate (“needs fertilizer”) showed poor growth. However, the two highest f rates resulted in similar growth, suggesting that the maximum rate was unnecessary (“needs less fertilizer”).
RGB color values revealed crop-specific responses. For marigold, pepper, and sage, higher fertilizer rates led to decreases in both red and green values — for example, marigold’s red values dropped from 130 to 120, and green from 175 to 169. In contrast, basil responded differently: Red values increased from 127 to 149, and green from 172 to 186. Across all crops, the blue channel values were less sensitive to fertilizer levels.
How Accurate Are Machine Learning Models?
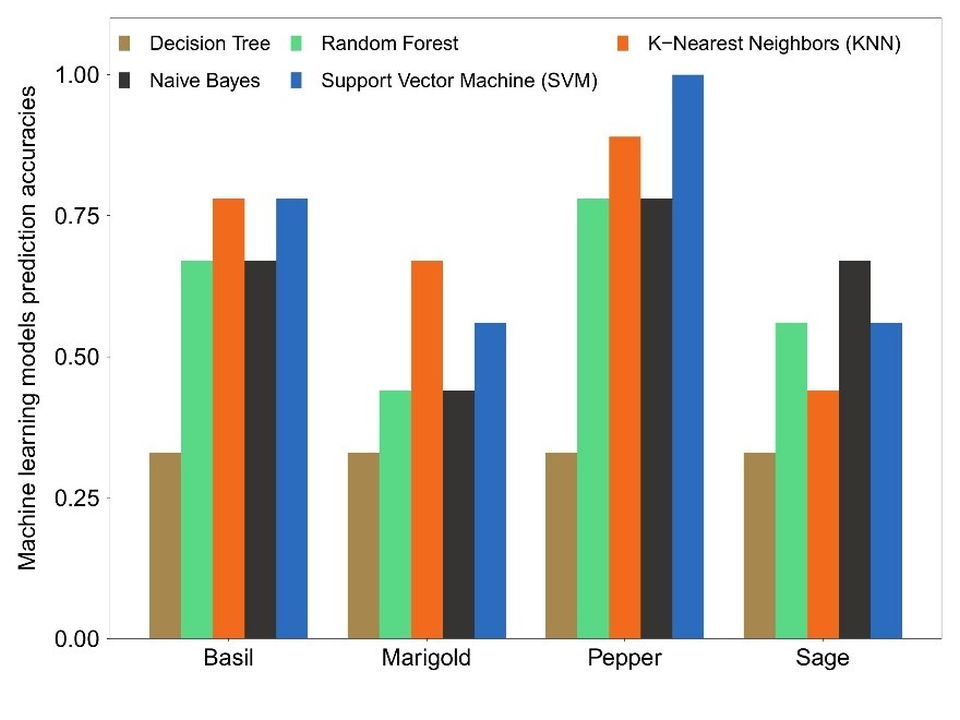
Figure 4. Machine learning models accuracy.
Machine learning models using RGB imaging were able to detect nutrient differences in plants within two to three weeks of treatment. Accuracy varied by crop:
- Basil: Highest accuracy (0.7–0.8) between 10–17 days
- Marigold: 0.6–0.7 accuracy between 10–15 days
- Pepper: Highest accuracy (0.9–1.0) between 17–24 days
- Sage: 0.6–0.7 accuracy between 21–25 days
Overall, the models reached peak accuracy within that 2-to-3-week window, offering a reliable early indicator for adjusting fertilizer practices (Figure 4).
Looking Ahead
The results of this study highlight the potential of combining RGB imaging with machine learning to improve fertilizer scheduling and nutrient management in container-grown plants. This approach offers an affordable and practical solution for real-time nutrient monitoring, requiring only a basic RGB camera setup. In fact, smartphone images or budget-friendly equipment like a Raspberry Pi with a low-cost camera (under $100 total) can be sufficient to get started.
That said, this method isn’t a perfect fit for every scenario. Early-stage nutrient deficiencies can be harder to detect when plants are young and less responsive to nutrient stress. In these cases, more advanced tools such as multispectral imaging may provide better sensitivity to subtle physiological changes.
As with any new technology, growers should test the system on a small scale before fully implementing it.
Subscribe to eNewsletter