


Calculating Crop Costs
There is no way around it: Profit = Revenue–Expenses. When we need to increase, or more commonly maintain, profit, the only way to do so is by increasing revenue or decreasing expenses. The standard reaction is to target the most obvious expenses–labor, fuel costs, plant materials or drop unprofitable crops and product lines. While that sounds simple enough, every business owner knows that actually doing this is much more difficult and time consuming than it seems. The solution–make your best guess as to which expenses can be reduced and which crops are unprofitable. Even in this day when a large number of tools are available to help analyze a business’s finances, a surprisingly large number of business owners operate from instinct and lack numbers upon which to make important decisions.
So where to start? There are a number of ways to look at a business’s expenses and crops. The simplest method, of course, is the one many folks already use. If there is money in the checkbook at the end of the year, the business made money and is doing all right. Unfortunately, the days when that was enough to run a business are limited.
Variable Costs
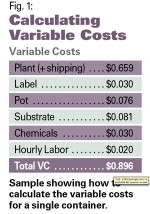
The first step in cost accounting for a business is typically to divide expenses into two categories: Variable and Fixed. Variable expenses, also called direct or allocated expenses in some situations, are those that vary with the amount of crop you are growing. Variable expenses typically include pots, plugs, seed, substrate, labels, chemicals, etc. Many growers commonly do this on a per unit basis (pot, flat, basket, bunch); see Fig. 1 for an example calculation. Most of the calculations are fairly straight forward with the exception of labor. While determining the cost of a crop is most accurate if you are able to allocate labor per unit of crop, labor can be lumped with fixed expenses initially. Dividing labor costs among the various crops, species and units (i.e. 4-inch pots, Jumbo 6s, baskets) can be a daunting task and is best handled after you have gained more experience in cost accounting.
Fixed Costs
Fixed costs are those expenses that have to be paid whether or not a crop is produced, including depreciation, insurance, marketing, management salaries, etc. One shorthand method for handling fixed costs is to calculate the amount of variable costs per unit container or bunch and multiply that number by 1.5 or 2 to yield the total cost per container or bunch. For example, the estimated total cost for a pot could be calculated as follows:
$0.896/pot (variable cost) x 1.5 = $1.344/pot (total cost)
This method is quick and easy and surprisingly accurate is some situations. Unfortunately, in most operations, however, the total amount of fixed costs need to be determined.

Add total used each month:
Jan. 35,000 ft2 * 44 weeks,
Feb. 22,000 ft2 * 4 weeks, etc.
Total 2,860,000 square foot weeks
Calculating overall $/ft2/wekk, using only the available
production space that is being used to produce crops.
Dollars Per ft² Week–52 Week Method
The next step is to determine how to spread the fixed costs over all the plants being produced. One method for allocating fixed costs to individual crops is called the dollars per square feet week method ($/ft²/week). The total fixed costs are divided by the total amount of useable space in the greenhouse by the number of weeks the space is used. Greenhouses that keep their spaces full and grow crops in a fast, efficient manner tend to be more profitable, which is reflected by a low $/ft²/week figure. The following are the steps for calculating the $/ft²/week method.
1. Calculate the amount of space required by each pot and the amount of time that pot is in the greenhouse.
2. In a separate calculation, divide the total amount of fixed costs by the total ft² weeks for the greenhouse, which is determined by multiplying the total amount of useable greenhouse space by the number of weeks in the year.
$335,000 ÷ (85,000 ft² x 52 weeks) = $0.0758/ft²/week
3. Next, multiply the total ft² weeks for the pot by the overall $/ft²/week for the greenhouse to yield the cost per pot:
2.222 ft² weeks x $0.0758/ft²/week = $0.168 per pot
4. Finally, add the estimated fixed cost to the variable cost to get the final cost per pot:
$0.896 (variable cost) + $0.168 (fixed cost) = $1.064/pot
Well, now we have an accurate cost per pot–right? Oh, if only it were that easy. The problem with this method is that while it is more accurate than guessing, no greenhouse operation is able to keep its space constantly filled. The above example used a mythical greenhouse in never-never land that had all of its benches filled with crops all year long.
Dollars Per ft² Week–Estimated Space Method
So, the next step is to make the dollars per ft² week method more accurate. We do this by estimating the actual amount of space we are using in the greenhouse, which is illustrated in Fig. 2.
1. Estimate the percentage of space usage for each month and multiply by the number of weeks in the month. Finally, add all of the figures for each month together.
2. Divide the total amount of fixed costs by the total estimated ft² weeks for the greenhouse:
$335,000 ÷ 2,860,000 ft² week = $0.1171/ft²/week
3. Next, multiply the total ft² weeks for the pot by the overall $/ft²/week for the greenhouse to yield the cost per pot:
2.222 ft² weeks x $0.1171/ft²/week = $0.260 per pot
4. Finally, add the estimated fixed cost to the variable cost to get the final cost per pot.
$0.896 (variable cost) + $0.260 (fixed cost) = $1.156/pot
Okay, now the cost of the pot is much more accurate. There are other ways to get the cost even more accurate but that would be a topic for another article.
Industry Averages For Dollars Per ft2 Week
Once growers calculate the $/ft²/week for their business, they usually want to know how their fixed costs compare with other businesses.
In 2005, Megan Bame completed her Masters thesis on cost accounting in the floriculture industry. During that study, she determined the $/ft²/week for wholesale and retail bedding/potted plant producers. Values are presented three different ways for useable bench and floor space: 1) using the 52 weeks method described above, 2) using the estimated space method described above, and 3) plus the amount of space allocated to overhead hanging baskets and using the 52 weeks method.
The last point addresses an issue in greenhouse production that can be difficult to resolve–hanging baskets. Some growers consider hanging baskets to occupy “free” space if they are located above benches or floor space that is filled with other crops and has already been assigned fixed costs. Other growers distribute fixed costs over all the production units, including hanging baskets. To calculate the third method, we included the space occupied by hanging baskets.
Another way to compare $/ft²/week among businesses is to look at them based on the size of the businesses. The $/ft²/week tends to vary with the size of the business with largest businesses having the lowest values. For example, larger businesses tend to have high space usage and allocate more of their fixed costs as variable costs (especially labor). Figure 3 shows an example of how to use the $/ft²/week figure and what it means to the price of a flat of impatiens. Of course, there a number of ways to manipulate the numbers to try to decrease the cost per unit. Figure 4 shows what happens when you decrease the $/ft²/week from $0.10 to $0.08, when you decrease the amount of time used to grow the crop (i.e. use larger plugs) or when you decrease the amount of space the crop takes up.
Other Methods
While $/ft²/week is one of the most commonly used methods, the same idea can be used in other ways. Some growers use $/unit (flat, pot, basket, stem) and divide total fixed cost by number of units. Other use $/unit labor and divide total fixed cost by number of hours or dollars of labor. Either of these methods may be easier for you to use or may make more sense for your operation.
To finish, let’s go back to one of the original questions we posed in this article–how do you get started?
– Take what numbers you have and make a quick calculation, get comfortable with the process.
– Refine the process, improve your record keeping.
– Check out the following Web site for additional info: www.wtextension.utk.edu/hbin.
– Whatever you do–do something!
After you get a little more comfortable with what you are doing, try “variabilizing” as many costs as possible. In other words, take as many expenses as possible and assign them to specific crops. For example, estimate the pesticide usage that is needed for various crops and move that expense from fixed to variable.
Generally, the most important expense to “variablize” is labor. For a small operation, have each person mark a checklist at the end of the day with the amount of time they spent on each task. The smallest unit should be no more than ¼ hours or tens of hours, such as 2.5 hours on transplanting begonias and 1.5 hours on general watering.
A simple standardized checklist ensures that everyone uses the same language and makes tallying the checklist easy. For larger operations that use crew leaders, have the crew leader fill out the checklist for each person in his crew and turn that in at the end of the day. Another option is to put the checklist on a computer spreadsheet and have each person enter the number of hours directly into the spreadsheet, reducing the data entry and management time required. On the sophisticated side, computer software is available to help track labor costs.
Finally, after you have mastered a method for reviewing expenses and crops, change it around and try one of the other methods discussed above. Using a new method will give you a fresh look at your business.
Subscribe to eNewsletter