


Beyond the Dashboard: The Future of Greenhouse Data Visualization
 July 21, 2025
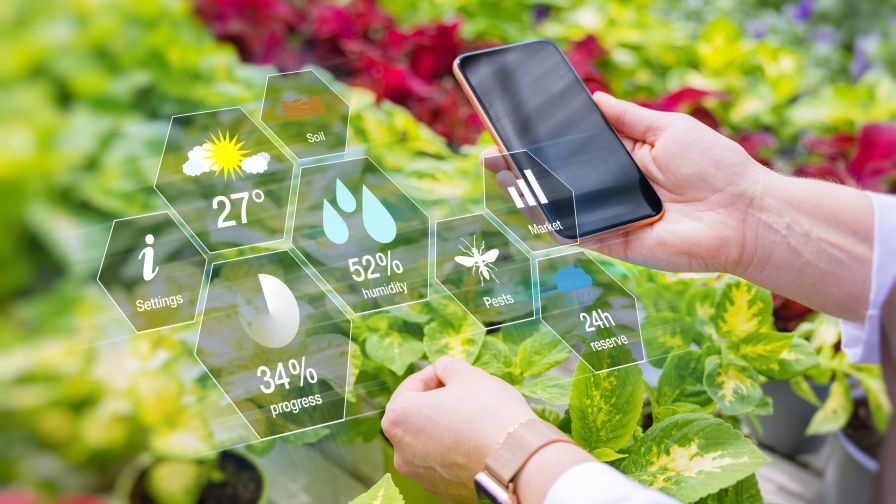
A woman using smart tech for greenhouse plant management | Kaspars Grinvalds via Adobe Stock
As someone whose early academic career was shaped by infographics – and whose professional journey led into agile project management, augmented reality (AR), and immersive technology – I believe greenhouse data visualization is due for a transformation. We must move “beyond the dashboard” and toward adaptive, tech-driven environments that help growers not just see data, but act on it with precision, intuition, and confidence.
The Problem with Today’s Dashboards
Dashboards, as we know them, are two-dimensional control centers that aggregate sensor readings into charts, gauges, and heat maps. While functional, they are static, abstract, and often fail to capture the context behind the numbers. For instance, seeing a CO₂ spike might prompt a ventilation tweak – but without knowing how that spike correlates to photosynthetic output or plant stress signals, the response may be insufficient or mistimed.
Moreover, the overload of metrics and toggles can lead to what I call “dashboard fatigue,” where growers either ignore certain alerts or become overwhelmed by complexity. And for teams managing large-scale operations, the disconnect between frontline workers and digital dashboards becomes a real barrier to responsiveness.
Visual Thinking in Agriculture
Early in my career, I became obsessed with the power of infographics. Good data visualization is more than aesthetic; it is functional art. It should inform, guide, and compel action. This design-first mindset is especially critical in agriculture, where seasonal rhythms, environmental factors, and human labor intersect in unpredictable ways. When I transitioned into agile project management, I found that greenhouses could be thought of as living “Kanban boards” – where flow, feedback loops, and visualization tools help teams identify bottlenecks and continuously improve operations.

As part of Harrisburg University’s XR Taskforce and my research into AR in greenhouse environments, I’m exploring how we can radically redesign the grower’s relationship with data.
Augmented Reality for Growers
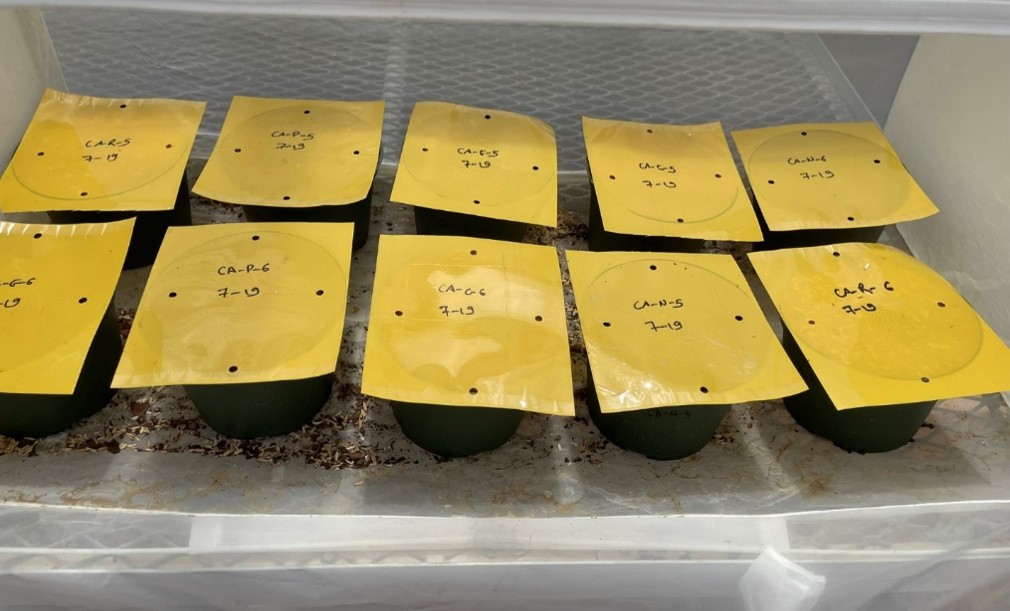
Imagine standing in your greenhouse wearing lightweight AR glasses or holding a tablet. You glance at a plant, and overlaid directly in your field of view are live indicators of that plant’s moisture content, pest activity, heat maps, and recent growth. Instead of flipping between dashboards and manual logs, you engage directly with your environment in real time.
AR lets us anchor data to place and object, making it intuitive and spatially relevant. It leverages what cognitive scientists, such as Margaret Wilson of the University of California, Santa Cruz, call “situated cognition” – the idea that our understanding deepens when knowledge is connected to our physical surroundings.
For greenhouse operations, spatial data visualization can mean:
- Faster decisions: Visual alerts tied to plants or zones eliminate the need to cross-reference spreadsheets or wait for lab results.
- Reduced training time: New workers can learn on the job with embedded AR instructions guiding their tasks and showing what “normal” looks like.
- Collaborative planning: Teams can hold visual stand-ups inside a virtual greenhouse model, identifying crop issues and aligning priorities.
Integrating Agile Thinking into Growing
In my teaching and research, I often describe project management as a form of disciplined storytelling. Agile methodologies, such as Scrum or SAFe, encourage us to visualize work in progress, track value delivery, and adapt in short cycles. What if we applied these same principles to greenhouse operations?
With AR-enabled dashboards, we can visualize tasks across the system (e.g., seeding, watering, harvesting), monitor backlog (missed tasks, delays), and conduct “retrospectives” to assess what’s improving yield. Combined with real-time data, growers can identify trends, adapt to weather variability, and experiment with regenerative practices.
Designing for Adoption, Not Just Access
Technology in agriculture often fails not because it lacks potential, but because it lacks usability. The best systems are built with growers, not just for them. That’s why my research combines ethnographic methods with design thinking.
The convergence of digital farming tools and decision-support systems will only be successful if they align with growers’ habits, language, and value chains. A flashy interface without empathy is destined for shelfware.
As I look ahead, my research agenda includes prototyping new AR-based design tools for hydroponic systems, experimenting with embedded IoT for live plant feedback, and publishing on how agile mindsets can support continuous improvement in controlled agriculture environments.
Subscribe to eNewsletter