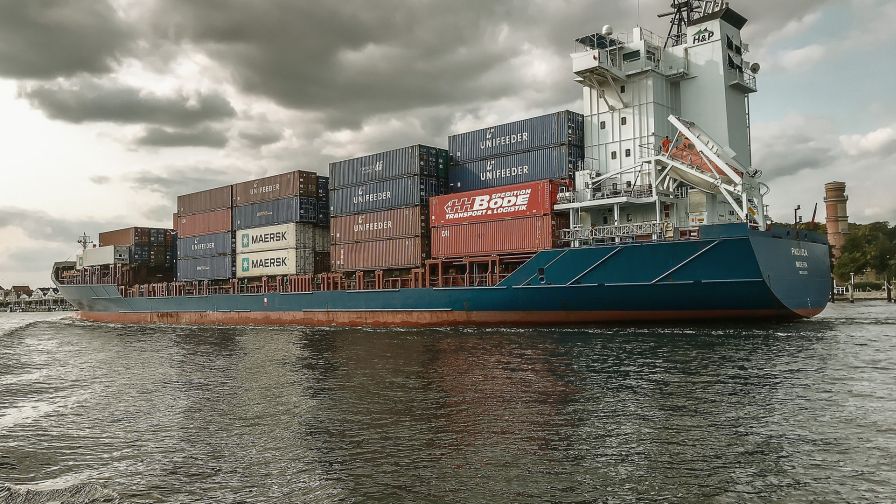
Here’s Which Ports Are Causing the Most Supply Chain Issues
 CNBC’s Supply Chain Heat Map, a new data tool CNBC created along with 10 of the world’s top maritime and logistics data providers, shows the scores of challenges facing the global supply chain in real time, so anyone can understand the inventory problems facing companies.
The drop in Shanghai’s port productivity, for example, is driven by to the lack of people working due to COVID-19 lockdowns and can be seen in the container wait time at the port, according to the Supply Chain Heat Map.
Trade is a forward-looking indicator of a country’s economic health as well as a company’s supply chain. A vessel at rest is not making money. A container at rest means inventory issues. The heat map tracks all of the critical pieces within the supply chain: factory capacity, vessel availability, container availability, trucking capacity, port productivity, vessel transit time. and rail capacity.
The Supply Chain Heat Map shows the challenges do not stop in China. According to MarineTraffic and Blume Global data, the Port of Oakland tops the list of congestion, with vessels taking six days to unload and load. Import containers are lingering almost 11 days in the port before they are transported. The Port of Los Angeles is the second highest in wait times, clocking in almost 12 days containers to leave the port and five and a half days for vessels to be processed. Rail delays of 6.2 days are also plaguing the port’s productivity.
The continued congestion on the West Coast has increased the flow of trade to the East Coast and Gulf ports. The Port of New York and New Jersey has greatly benefited from this trend.
Continue reading at CNBC.com.


