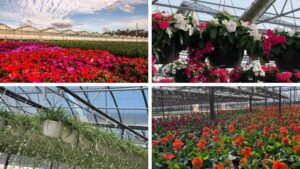


Where Will Greenhouse Growers Be Spending Money in 2023?
 January 15, 2023
 Costs to produce plants are going up. There’s no getting around it. Greenhouse Grower wanted to understand what those expenditures look like for growers and in what areas they expect to see increases or decreases in 2023, so we asked about expenditures in areas such as labor, structures, and containers.

View all


Sixty growers responded to the survey, with nearly 56% of those respondents falling in the small category of less than 100,000 square feet under cover, 33% in the large grower category (100,000 to 999,999 square feet), and 11% in the very large classification of 1 million square feet or larger. Many of the survey respondents grew ornamentals (78%), with 11% being vegetable growers (fresh market, fully mature produce), and 11% growers that grew some combination of ornamentals, vegetables, and cannabis/hemp. Additionally, 44% of the respondents call the Northeast U.S. home, 33% were outside the U.S., 11% in the Midwest U.S., and 11% in the Southwest U.S.
Check out the slideshow for an overview of each spending category, and keep reading for more details.
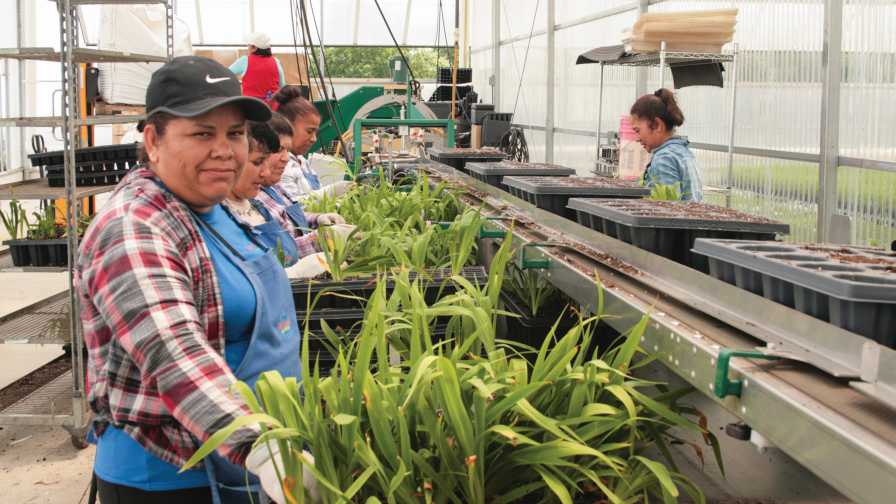
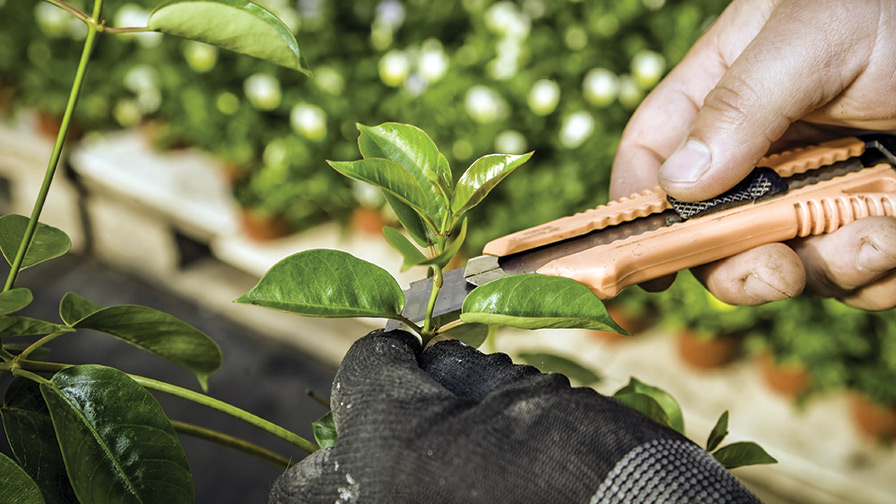
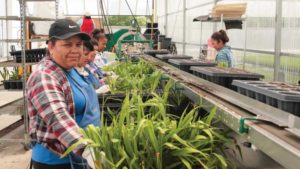
Labor
Labor, unsurprisingly, was the largest average expenditure category for growers, with 60% of survey respondents saying they spent $500,000 or less to employ workers in 2022, followed by 13% spending $1 million to $5 million. While a few growers said they expect to see some labor expenditures stay the same or decrease for 2023, most survey respondents expect an increase in labor costs going into the new year.
How do you expect your 2023 expenditures for labor to compare to your 2022 expenditures?
- 33%: Increase 1% to 5%
- 27% Increase 6% to 10%
- 15%: Increase 11% or more
- 13%: Stay the same
- 2%: Decrease 1% to 5%
- 2%: Decrease 11% or more
- 8%: Not applicable
What were your average expenditures for labor in 2022?
- 60%: $500K or less
- 13%: $1 million to $5 million
- 5%: More than $50 million
- 5%: $10 million to $20 million
- 2%: $30 million to $50 million
- 2%: $20 million to $30 million
- 2%: $5 million to $10 million
- 11%: Not applicable
Crop Nutrition/Fertilizers
Fertilizer prices have increased more than most inputs, in some cases nearly doubling between the summer of 2020 and the end of 2021, according to Aaron Smith of University of California, Davis, in his “The Story of Rising Fertilizer Prices” article. Thirty-seven percent of survey respondents expect to be paying some of those higher prices, predicting an increase in spending of 11% or more for 2023.
How do you expect your 2023 expenditures for crop nutrition/fertilizers to compare to your 2022 expenditures?
- 36%: Increase 11% or more
- 25%: Increase 6% to 10%
- 22%: Increase 1% to 5%
- 12%: Stay the same
- 2%: Decrease 1% to 5%
- 0%: Decrease 6% to 10%
- 2%: Decrease 11% or more
- 1%: Not applicable
What were your average expenditures for crop nutrition/fertilizers in 2022? (controlled-release, liquid, granular, organic, water-soluble, etc.)
- 80%: $100,000 or less
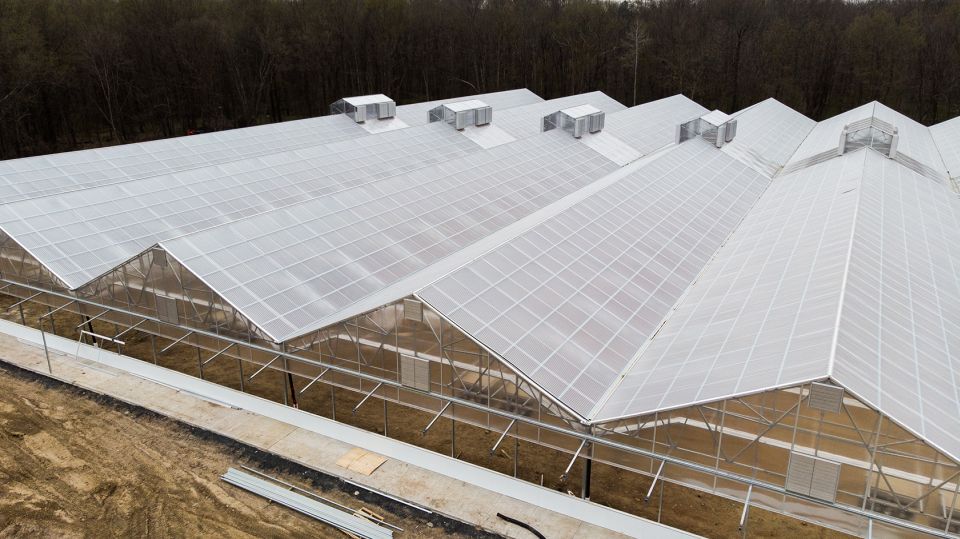
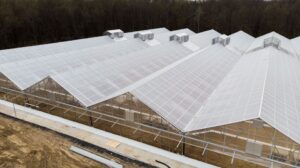
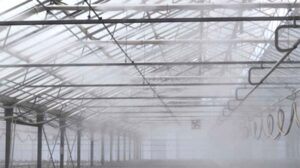
Structures
Looking at both ends of the spectrum, 30% of survey respondents expect monetary outlay in the structures area, whether for new construction, retrofits, coverings, or maintenance, to increase by 11% or more, while nearly 7% of those surveyed expect costs to be lower by 11% or more.
How do you expect your 2023 expenditures for greenhouse structures to compare to your 2022 expenditures?
- 30%: Increase 11% or more
- 18%: Stay the same
- 17%: Increase 6% to 10%
- 13%: Increase 1% to 5%
- 11%: Not applicable
- 7%: Decrease 11% or more
- 2%: Decrease 6% to 10%
- 2%: Decrease 1% to 5%
What were your average expenditures for greenhouse structures in 2022? (retrofits, new construction, greenhouse coatings and sealants, greenhouse coverings, shadecloth, greenhouse curtains, shading systems, etc.)?
- 67%: $100,000 or less
- 14%: $100,000 to $250,000
- 3%: $250,000 to $500,000
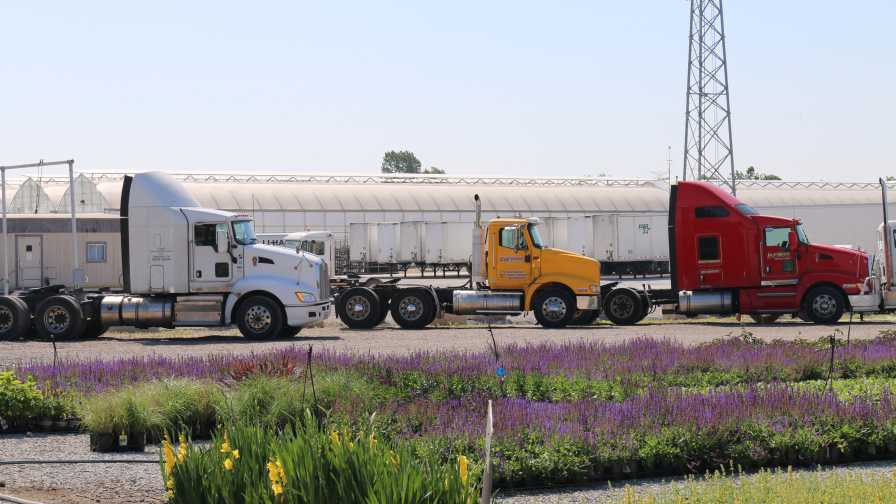
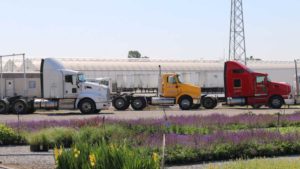
Transportation
The costs for transportation in the greenhouse industry are at the highest levels anyone has experienced in years. Around 77% of survey participants expect to spend more on transportation in 2023, ranging from 11% or more (25%) at the top end to 1% or 5% (23% of respondents) on the lower side of the expected increases.
How do you expect your 2023 expenditures for transportation (freight, drivers, trucks, etc.) to compare to your 2022 expenditures?
- 28%: Increase 6% to 10%
- 25%: Increase 11% or more
- 23%: Increase 1% to 5%
- 13%: Not Applicable
- 7%: Stay the same
- 2%: Decrease 6% to 10%
- 2%: Decrease 11% or more
What were your average expenditures for transportation (e.g., freight, drivers, trucks, etc.) in 2022?
- 50%: $500,000 or less
- 18%: Not applicable
- 10%: $100,000 to $250,000
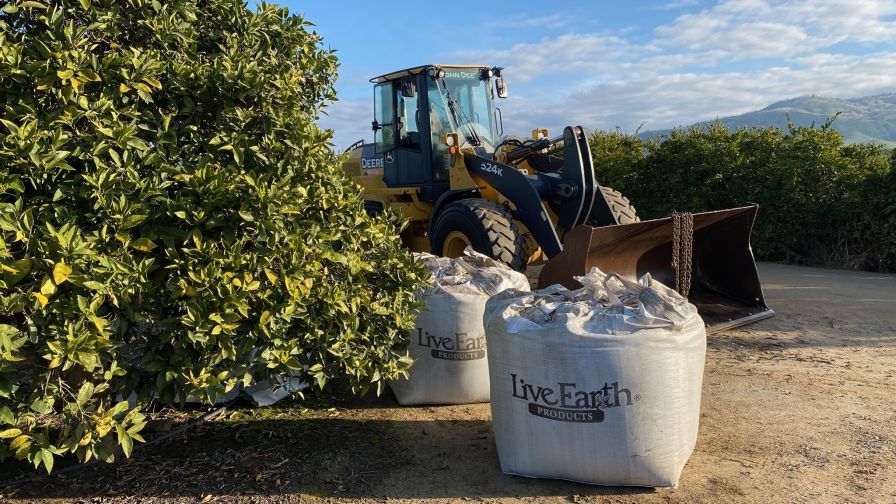
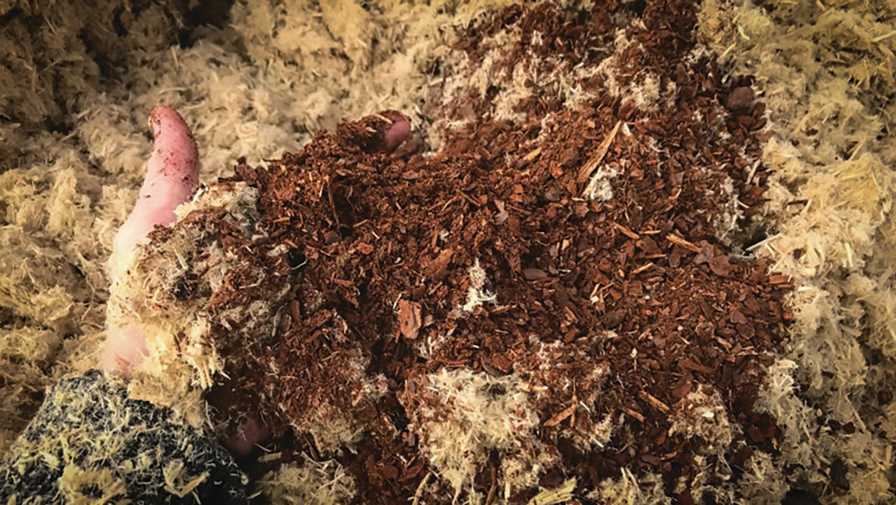
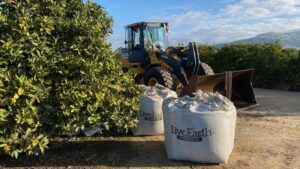
Growing Media
Growing media has felt like one big question mark over the past year. Is there enough to go around? Can growers source the components they need to mix their own media? Twenty-four percent of survey respondents are anticipating their growing media expenditures to increase by 11% or more over 2022 spending in the new year.
How do you expect your 2023 expenditures for growing media to compare to your 2022 expenditures?
- 34%: Increase 6% to 10%
- 29%: Increase 1% to 5%
- 24%: Increase 11% or more
- 7%: Stay the same
- 2%: Decrease 1% to 5%
- 2%: Decrease 11% or more
- 2%: Not Applicable
What were your average expenditures for growing media (custom soil mixes, perlite, sand, vermiculite, peat, wood fiber mixes, premixes, etc.) in 2022?
- 68%: $100,000 or less
- 8%: $100,000 to $250,000
- 8%: $250,000 to $500,000
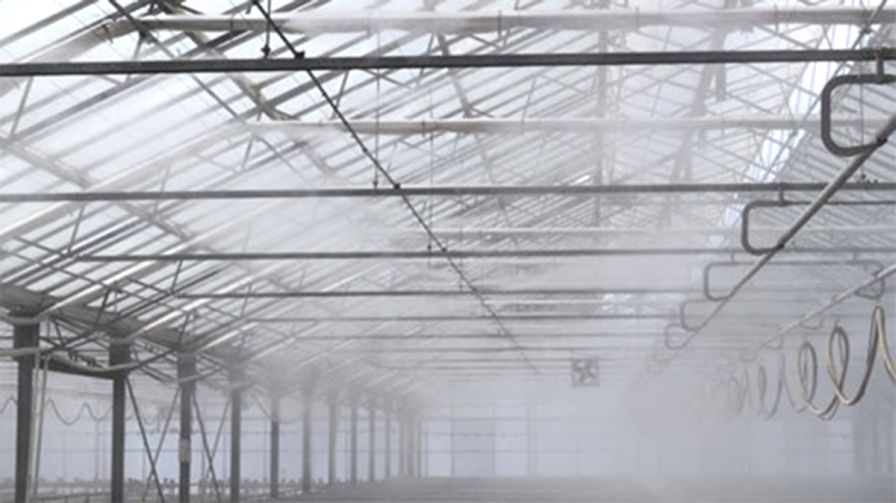
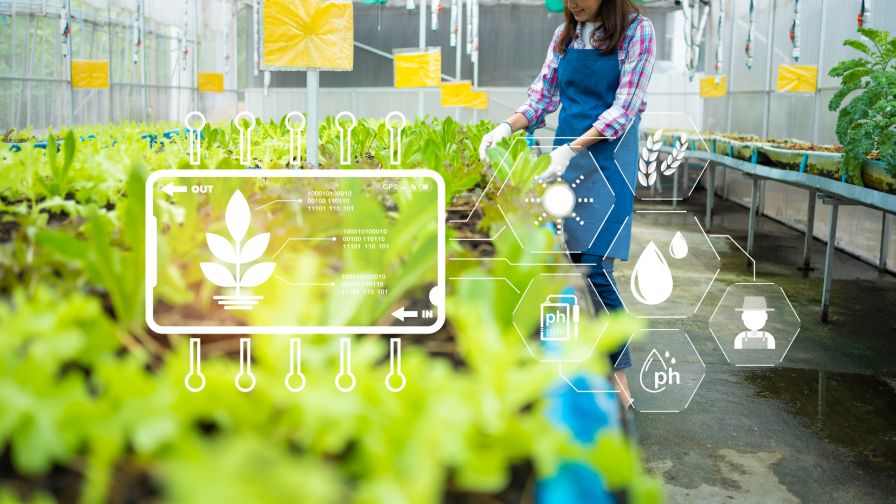
Irrigation/Water Management
Irrigation/water management was the one area where the largest percentage of respondents plan on expenditures staying the same for 2023.
How do you expect your 2023 expenditures for irrigation/water management to compare to your 2022 expenditures?
28%: Stay the Same
27%: Increase 1% to 5%
22%: Increase 6% to 10%
13%: Not Applicable
5%: Increase 11% or more
5%: Decrease 11% or more
What were your average expenditures for irrigation/water management (automated dosing systems, booms, drip irrigation, ebb and flow systems, flood floors, flood benches, fogging/misting equipment, irrigation controls and systems, water filtration, water disinfection, etc.) in 2022?
- 75%: $100,00o or less
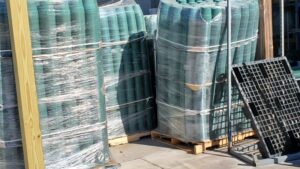
Containers
Sourcing containers is still a bit touch and go. Companies are ordering far in advance of their need, sometimes without having definitive answers on the quantities they’ll need. Most survey respondents expect expenditures for containers to go up in 2023. One survey respondent anticipates a decrease of 11% or more for container purchases for 2023 when compared to 2022 spending, while 3% of respondents expect costs to stay the same.
How do you expect your 2023 expenditures for containers to compare to your 2022 expenditures?
- 36%: Increase 11% or more
- 32%: Increase 6% to 10%
- 25%: Increase 1% to 5%
- 3%: Stay the Same
- 2%: Decrease 11% or more
- 2%: Not Applicable
What were your average expenditures for containers (pots, trays, liners, flats, plug trays, hanging baskets, decorative patio containers, sleeves, wraps, etc.) in 2022?
- 69%: $100,000 or less
Subscribe to eNewsletter