


Wraps Taken Off USDA’s New Plant Hardiness Zone Map
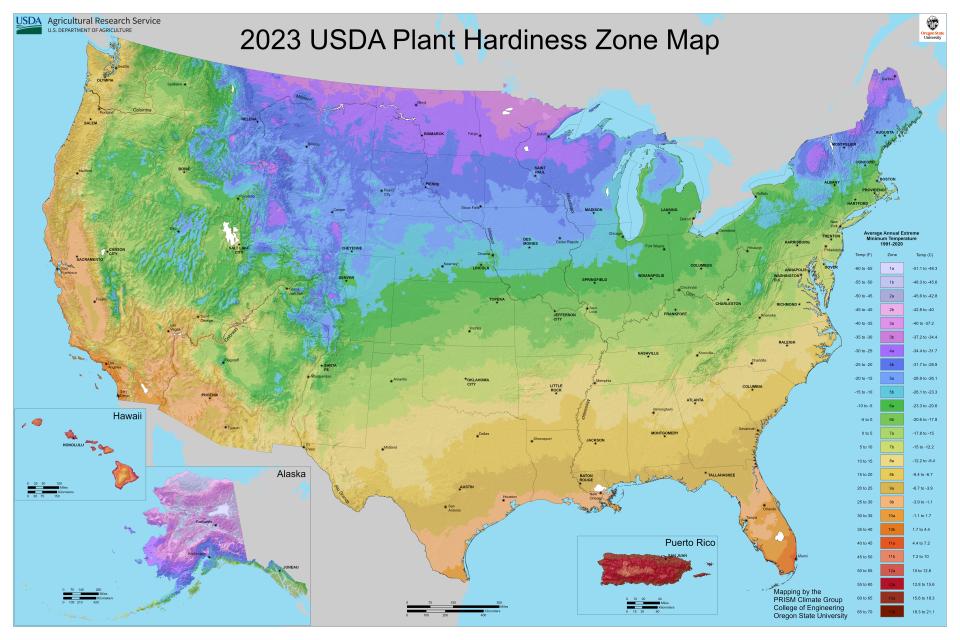
Here it is! After more than a decade, USDA has updated and released its Plant Hardiness Zone map. There are some noticeable changes from the last version.
Image courtesy of USDA-ARS
Do you remember where you were and what you were doing in 2012? It might be hard to recall all the details. After all, it was more than a decade ago. That was when USDA last updated its Plant Hardiness Zone Map, by the way. Fast forward to now. The government agency has just unveiled it new-and-improved Plant Hardiness Zone Map. And this one has some extra features.
The new map — jointly developed by USDA’s Agricultural Research Service (ARS) and Oregon State University’s PRISM Climate Group — is said to be more accurate and contain greater detail than prior versions. A big reason behind that is the amount of data being gathered from the field. The 2023 map incorporates data from 13,412 weather stations compared to the 7,983 that were used for the 2012 map, according to USDA.
Among the additions is a “Tips for Growers” section, which provides information about USDA ARS research programs of interest to growers and plant breeders.
Climate Changing?
Information to build the new map is based on 30-year averages of the lowest annual winter temperatures at specific locations. It is divided into 10-degree Fahrenheit zones and further divided into 5-degree Fahrenheit half-zones. USDA notes, “When compared to the 2012 map, the 2023 version reveals that about half of the country shifted to the next warmer half zone, and the other half of the country remained in the same half zone. That shift to the next warmer half zone means those areas warmed somewhere in the range of 0-5 degrees Fahrenheit; however, some locations experienced warming in the range of 0-5 degrees Fahrenheit without moving to another half zone.”


A Useful Tool
Plant hardiness zone designations represent what’s known as the “average annual extreme minimum temperature” at a given location during a particular time period.
Roughly 80 million American gardeners and growers represent the most frequent users of the Plant Hardiness Zone Map, says USDA. However, other entities use the tool on a regular basis for related purposes. USDA provides a few examples here: “Risk Management Agency refers to the map’s plant hardiness zone designations to set certain crop insurance standards. Additionally, scientists incorporate the plant hardiness zones as a data layer in many research models, such as those modeling the spread of exotic weeds and insects.”
The new USDA Plant Hardiness Zone Map can be viewed and downloaded at https://planthardiness.ars.usda.gov.
Subscribe to eNewsletter