


The Evolution of Smart Sales Forecasting for Greenhouse Operations
 July 2, 2022
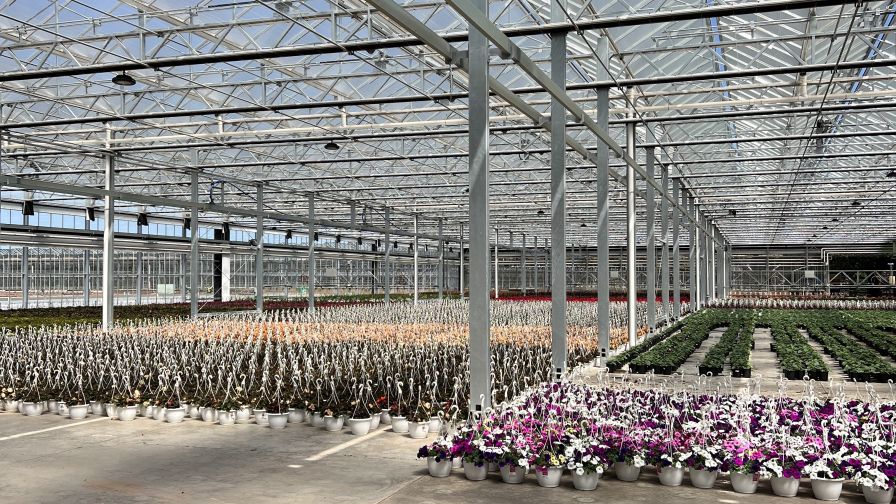
Photo: IUNU
When I speak with operators starting up new growing facilities for the first time, they often budget 5% to 10% variability in yield forecasting. For most operational greenhouses, forecasting variability is even larger than that. We’ve seen many growers struggle to get beyond 50% to 60% accurate with long-term forecasts.
Forecasting is not an easy task, though most assume it is. To accurately forecast, you must have good, clean data on harvested weights, understand your loss from stage to stage of growth, and factor in environmental and climate changes. And even then, we’re combining two biological systems into one system (weather and plants), which means plants can often break expected behavior as well.
Once we have all this data, we can begin to forecast based on classical forecasting models – such as using moving averages on past data (shorter term for short turn crops and seasonally for long turn crops).
Often, however, we’re not starting with all this data. Think about how you collect harvest data. Are you weighing a few trays or gutters to represent your entire lettuce batch? Or pulling sales data for potted plants? Or collecting fruit size information for one or two of your tomato plants and estimating across the entire crop?
You’re not alone. This is how most facilities collect data today. To date, it has been costly and/or labor intensive to do more than this.
Luckily, the world of forecasting is evolving. The ways we do things now are not going to be the way we do them soon. With business models like pay-by-scan and new technology such as artificial intelligence, forecasting models are becoming much more advanced and far more critical to revenue. This article dives deeper into the evolution of forecasting and what growers should be on the lookout for.
Evaluating Your Data
One of the core areas of opportunity for growers to improve forecasting is to start with the data you have on hand. As mentioned above, most facilities are not yet collecting complete harvest data for their entire facility. There have been a few advances in this area making it an easy starting place to upgrade your forecasting ability.
Integrating scales into your harvest line has never been easier. Whether you need to retrofit an existing line or build one into your future plans, consider adding a flow scale directly into your conveyor system. These systems allow you to capture all weights coming off your harvest line with little to no impact on your throughput speed. Make sure you have enough space in your harvest area to incorporate the extra conveyor space, as this can sometimes be the major constraint for these systems.
After you begin collecting this data, you might want to explore integrating your weight system with a digital platform to provide a dashboard of your current and historical weights. This also helps feed data into more advanced forecasting algorithms if you’re interested in going down that route. IUNU offers a product called Harvest Weight Capture that does this automatically. Some scale companies also offer the option to view data on a dashboard. If you’re not quite ready for digital solutions, it’s also possible to create your own dashboard using the data.
Weight data isn’t the only valuable source of data for forecasting (that you probably already have). Evaluate your crop registration process as well. How are you documenting quality checks, growth rates, germination rates, fruit sizing, and counts? How are you documenting issues such as diseases, pests, and loss? Are you documenting this for all crops or just a few from your samples? This is a missed area of data collection for growers and is not often fed into forecasting models. There are new tools available to help collect this information – some more manual and some fully automated. It’s worth exploring what it would cost to have humans collect this data and what the value of this data would be (for every single plant) to help you create a budget and expected return on investment for any technology investments.
Lastly, identify your source of data for climate and weather. If this data is collected by a system, can it be pulled out of that system through an API? Can you download an export of the data? Can it be viewed in a dashboard alongside weight data? Weather and climate data are a massive contributor to yield forecasts, and having this information available for your forecasts is critical. Chances are, you’re already sitting on a goldmine of data and now it’s time to use it to improve the accuracy of your forecasts.
 Forecasting of the Future
With more advanced technology in the market and more data collection than ever before, forecasting is becoming easier and more accurate with automation and less reliance on labor. Once you begin collecting weight data, crop registration data, weather, and climate data, you’re in a good position to begin forecasting. If collecting this information and forecasting manually, try a few different methods for building your forecasts.
If you want to automate your forecasts and use advanced forecasting methods such as using artificial intelligence, consider adding a digital platform to your toolkit. Systems like LUNA AI allow you to integrate your harvest weight data, your climate and weather data, and your crop registration data into an AI powered platform. In addition, computer vision models introduce an entirely new dataset for forecasting – imagery of the plants. This allows you to evaluate both how the plant performs (yield) and how the plant is performing real-time (growth and quality). These combine to create the most accurate models for forecasting possible.
The other benefit of these advanced AI systems is the ability to automate the data collection process. While the idea of completing crop registration for every tomato plant in the greenhouse may seem daunting (and expensive), new technologies like LUNA AI can complete this for you, automatically. Instead of allocating highly skilled and expensive labor to crop registration, you can empower your scouts to perform this task daily.
New Models Affecting Forecasting
It’s also important to note new sales models that are demanding better forecasting. The days of forecasting at 50% to 60% accuracy are gone. Pay-by-scan is a payment model affecting most ornamental growers (for those who haven’t moved to pay-by-scan yet, it’s likely coming in the near future. Check out this great article in Greenhouse Grower on the topic.). Big box stores moved to this model forcing inventory to be the grower’s responsibility rather than the retailer’s. Now rather than retailers paying the grower for inventory, the retailer pays the grower only when inventory sells. While this model enables growers to become part of the merchandising process, it also ensures growers must pay attention to inventory counts, forecasting, and variety selection on a more detailed level than ever before.
For lettuce growers, the concept of offtake agreements has become a common lever for financing over the last few years. Instead of selling products as you grow, you agree to pricing and quality specs with buyers in advance, for longer periods of time. This helps financing parties get comfortable with the sales risk of new facilities and helps growers guarantee the output of the facility. This model only works if you can forecast accurately. If you continuously miss numbers, you lose trust with your buyers and potentially risk losing the contracts.
New financing parties are also interested in accurate forecasting. Growers who can forecast within a few percentage points are at a lower risk of defaulting on loans. Having this ability adds a massive advantage when seeking capital in a competitive market. As new debt providers enter the market and more companies compete for large pools of capital, it’s worth exploring what lenders can offer you (better rates, more capital, better terms) if you can provide more accurate forecasts than competitors.
Matching Forecasting and Sales Demand
Ultimately, forecasting is a tool for increasing revenue. Once you’ve evaluated your data, your business model, and the tools to assist with better forecasting, it’s time to look to sales.
One grower we work with was struggling with forecasting. They couldn’t get their inventory counts accurate and, as often is the case with fast turn crops, they would pull product early or push it out late to meet live customer demand. When they hit their busiest week of the season, the team had pulled too much crop out early to meet a customer order a week before, leaving less inventory on the floor to pull. As a result, their largest customer backed out on future orders and reduced the sales plan for the year. This broken trust took months (and for some growers years) to repair.
By implementing the tools to forecast better, more accurately, and in real-time, the grower has yet to miss a sales order and has increased throughput dramatically. Their long-term forecasts went from being around 50% accurate to over 90%.
These are the types of changes smarter yield forecasting can deliver. By matching forecasts with sales planning, you can empower your sales team to outperform revenue goals year over year.
Business models are changing. Artificial intelligence has become commonplace. Tools are becoming more valuable. Smarter yield forecasting can change your business. How will you evaluate implementing these practices for your operation?
To find out more about smarter yield forecasting, reach out to me by emailing [email protected].
Subscribe to eNewsletter