



The Road to More Sustainable Floral Transportation
 July 17, 2026
 For some domestic flower supply chains, the biggest climate impact may not come from growing flowers. It may come from moving them.
In a study of open-field flower production in North Carolina, we found that transporting flowers from farms to florists created nearly 90% of the carbon emissions in the supply chains we evaluated. Production and cold storage were much smaller contributors, 9% and 2% respectively.
To lower the carbon footprint of these supply chains, we identified several opportunities to reduce transportation-related emissions. These include minimizing the number of delivery trips by combining shipments (think fewer and fuller loads), increasing the use of electric vehicles, and using wholesale hubs to efficiently distribute flowers at high volumes.
This matters for a growing domestic flower industry, as cut flower production expands in the U.S. Consumer demand for locally grown flowers and floral industry movements, such as Slow Flowers, have contributed to a rise in regional flower production and distribution networks. This trend was jump-started during the pandemic, as global supply chains were disrupted. In North Carolina alone, during the five-year span from 2017 to 2022, the number of cut flower operations nearly doubled from 218 to 400 farms (USDA National Agricultural Statistics Service 2019, 2024).
In addition, rising prices for fuel, fertilizer, pesticides, equipment, and other agricultural inputs have increased production costs in recent years in the U.S., reinforcing the need for greater resource efficiency.
While most cut flowers sold in the U.S. are imported, often through global supply chains that rely on air transportation, this study focused specifically on domestic flower distribution and carbon emissions through ground transportation within local and regional systems. As these networks continue to develop, understanding their environmental impacts allows us to best identify the opportunities to curb greenhouse gas emissions while supporting growth in domestic cut flower production and sales.
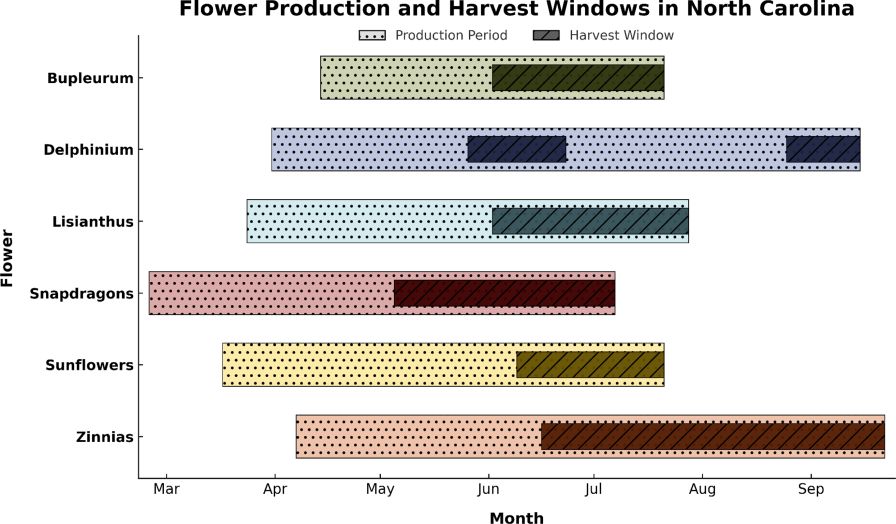
Representative open-field flower production periods by month in the Piedmont region of North Carolina based on survey responses and existing literature. The survey was administered in 2024.
Getting Feedback From Growers
To conduct the study, my fellow authors at North Carolina State University (Dr. Melinda Knuth and Dr. Minliang Yang) and I chose six representative flower and greenery crops: bupleurum, delphinium, lisianthus, snapdragons, sunflowers, and zinnias. We sent questionnaires to growers, retailers, and a wholesale hub in North Carolina’s Piedmont region to ask about flower volume grown, transported, and sold, as well as production methods, storage details, energy consumption, and vehicle/machinery use. After reviewing the survey responses for quality, we included data from 10 growers, 14 retail florists, and one wholesale distribution hub.
From this data, we estimated greenhouse gas emissions using a life cycle assessment, a method employed to measure environmental impacts of a product or process. We compared two ways of moving flowers from farms to florists: direct deliveries from growers to retailers, and a hub-and-spoke system, where flowers are first consolidated at a wholesale distribution hub. All the farms in the study used open-field production. We included emissions from growing the flowers, as well as storing and transporting them, and compared results on both a seasonal basis and a per-stem basis.
Transportation accounted for nearly 90% of the greenhouse gas emissions in the supply chains we evaluated. In situations where flowers were grown and sold at higher volumes, distributing them through a wholesale hub showed potential for reducing overall emissions. Replacing gasoline-powered vehicles with electric vehicles produced the largest reductions in emissions across the scenarios we modeled.
To better understand what these emissions mean, we also applied the social cost of carbon, an estimate of the economic damage caused by releasing one additional metric ton of carbon dioxide into the atmosphere. It includes costs such as damage from more frequent extreme weather and sea level rise, impacts on human health, and losses to agriculture and infrastructure. Assigning a dollar value to emissions helps translate environmental impacts into economic terms, making it easier for businesses and policymakers to compare the potential costs and benefits of different decisions. The most robust estimate for the social cost of carbon is currently $185 per metric ton of carbon dioxide.
Using that value, we estimated that for every $10,000 in seasonal sales, a modeled farm generated a social cost of carbon ranging from ~$70 in a fully electrified scenario to ~$1,000 in a high-travel scenario without a wholesale hub. In other words, the estimated social cost of carbon ranged from less than 1% to about 10% of seasonal sales. While growers and florists don’t directly pay these costs, the estimates illustrate that transportation decisions can have real economic consequences that extend beyond the floral industry.
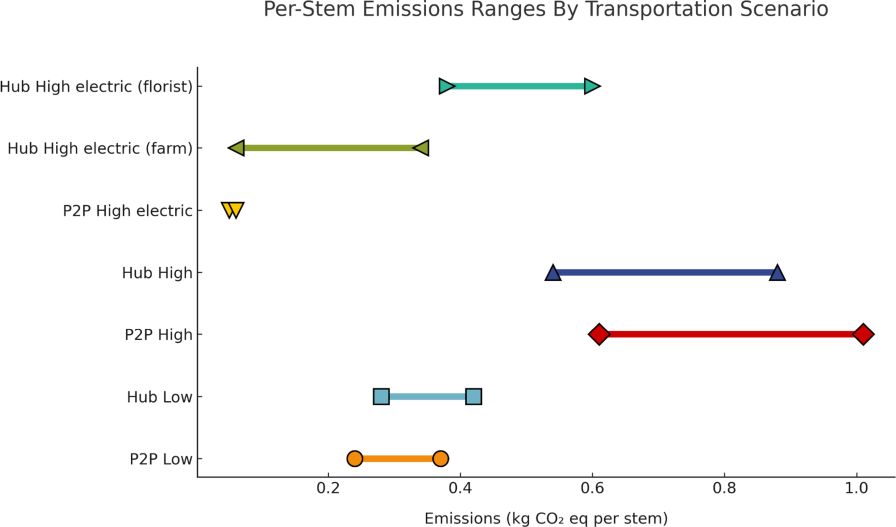
Greenhouse gas emissions (kg CO2 eq) on a per-stem basis for specialty cut flowers under seven distribution scenarios. Point-to-point (P2P) scenarios represent direct transport between farms and florists, while hub-and-spoke (Hub) scenarios consolidate deliveries through a wholesale hub. High-travel, low-travel, and electrified scenarios were modeled for both distribution systems. Values represent the sum of production, storage, and transportation emissions for six cut flowers grown in North Carolina.
Like any study, this one has limitations. We focused on a single domestic production system in North Carolina using field-grown flowers, which generally require less energy to produce than flowers grown in heated greenhouses. Because greenhouse production can use significantly more energy, the results could look quite different for those systems.
As domestic flower production continues to expand, understanding where emissions occur and where reductions are most achievable can help flower growers, wholesalers, and retailers make better informed decisions. In systems like the ones examined here, the greatest opportunities may lie not in how flowers are grown, but in how they move from farm to vase.
This study is one step toward understanding the environmental impacts of domestic flower distribution, but there is still more to learn. Future research could examine flower supply chains in other regions of the U.S., include greenhouse-grown crops, and compare domestic and imported flowers. Looking beyond carbon emissions to include other environmental impacts, as well as the economic and operational trade-offs, of different distribution systems would provide a more complete picture of how to build a more sustainable floral industry.
Thank you to the Association of Specialty Cut Flower Growers for financially supporting this research and to Rooted Farmers, Inc. for assisting with experimental design and data collection.
Resource: Solliday, A., Yang, M., and Knuth, M. (2026). Carbon Emissions in Production and Distribution Pathways of North Carolina’s Local Cut Flower Supply Chains. HortScience, 61(8), 1746–1758. https://doi.org/10.21273/HORTSCI19413-26
Subscribe to eNewsletter