


Why Data Drives Everything in Greenhouse Plant Production
 April 10, 2019
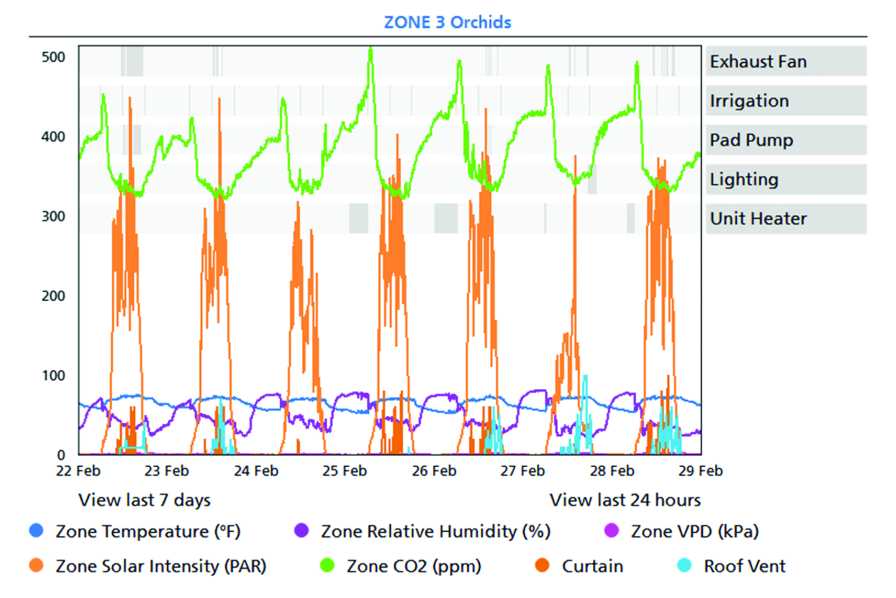
With Wadsworth’s Seed control system, selected equipment is listed along the right side of the graph. The run time for each piece of equipment is displayed in the gray band. Values associated with sensors are displayed as line graphs. The color of the line correlates with the color next to the sensor. Sensors may be deselected down to a single sensor. The time period adjusts down to the minute.
Today’s greenhouse controls have honed the data collection process to include by-the-minute gathering on climate conditions, including equipment run times, sensor readings, humidity, CO2, heating, and cooling.
Growers use data for a multitude of reasons, including those of their ancestors — to produce the highest yield of top-quality plants. They review and save data conditions that resulted in successful crops, identify issues causing plant stress and unexpected utility costs, forecast future yields, and find plateaus in increased plant quality verses costs. Growers at university facilities are asked for specific uses for data based on researcher requirements. Growers can review hot water heating temperatures to determine if their system is running correctly and adjust cooling setpoints to allow for better dehumidification.
Jeff Brower, Co-owner of J&N Greenhouses, uses data to track investment returns over time. The manufacturer of Brower’s fuel conditioning system based the return on investment on heating days for a warehouse, not a greenhouse with solar gain.
“I needed to do my own research on the benefits of the product since greenhouses don’t fit the manufacturer’s calculations for heating days,” Brower says. “I reviewed the solar data and counted cold days that were also solar gain days and found my heat usage didn’t match their numbers. It helped me see that the return on investment would be longer than predicted.”


Anthony Brach, Operations Officer of Photo-Science Management Group, uses data to be sure certain setpoints are within range for each time period. Alarms can tell when equipment is out of range, but data tells the details of what actually happened.
“Data drives everything,” Brach says. “It allows us to bridge the gap between yields and conditions. Data may explain differences in yields and help us consider tweaking the settings and see improved success.”
He also uses data for forecasting.
“You want to correlate the data to forecast what you’ll be harvesting. Then, quarterly, biannually, annually, you review your yield and the quality of the plants, and correlate that to your environmental statistics, which is dictating the results.”
Data can be based on seasonal parameters, crop stages, and equipment usage.
Of course, if you’re just starting out, you need to gather data for future use.
“I saw an impact my first season growing in a greenhouse,” Brach says. “As we went into winter, I thought I had a good PAR setting that would accumulate the right amount of moles, but that wasn’t correct. The crop suffered because I was making estimations.”
Looking at the same scenario with the addition of data, the grower would immediately identify the drop in the amount of moles and understand the need to change supplemental lights.
Nick Earls of Wadsworth Control Systems says that while many people use data as a method of troubleshooting, a twice-daily check of a saved report or graph helps growers keep tabs on the greenhouse environment.
“You’re looking at the same report when you arrive in the morning and last thing each evening, so you see discrepancies and respond quickly,” Earls says. “You may have an alarm on some equipment, not others. Keeping track helps you quickly catch inconsistencies that identify problems.”
Cost savings is always on growers’ minds. It’s costly to run lights, and tracking usage can save on utility costs. Some controls track DLI and turn lights off when the moles per day are reached. If your control doesn’t track moles, that doesn’t mean you can’t use the data to make lighting decisions.
“We actually take the DLI and figure out when we reach an accumulated sunlight level to be able to turn the lights off and shut the vents earlier,” Brach says. “If I’m running the lights two hours less each day and I can close the vents two hours earlier, it conserves heat, and over time there’s a lot of savings involved.”
Jane Farr, Director of Research and Extension at Auburn University, uses data in many ways, including keeping researchers happy by both exporting data to spreadsheets and providing information confirming greenhouse conditions are at requested levels. She stores data by professor and crop so she can respond to future inquiries. These same techniques can be used by commercial growers to track specific crop needs, confirm environmental conditions, and allow growers to manipulate data outside their control’s reports and graphs functions.
The future of data usage lies in machine learning and collection of larger data sets according to Will Justis, Software Programmer for Wadsworth Controls.
“When we approach data from an engineering standpoint, it’s a question of what’s possible,” Justis says “Ultimately, using sensing data to understand power consumption and how to optimize the system and lower energy costs becomes a driving force. Working with larger data sets and improvements in analyzing that data creates a feedback loop that opens up opportunities for machine learning and artificial intelligence.”
Brower sums it up nicely.
“Data doesn’t instantly answer the question, but it helps you figure out the answer.”
Subscribe to eNewsletter